Which Match Hurt Our Net Run Rate? A Practical Guide

By Yug Shah
|
Oct 19, 2026
|
|

The points table appears on the broadcast screen.
Four matches played. Three wins.
Yet the number beside Falcons is NRR −0.288.
The commentator looks across the desk.
“How can we win three matches and still be negative?”
Then comes the better question:
Which match hurt net run rate the most?
Finding the answer requires more than looking for the only defeat. Net run rate is calculated from aggregate scoring and conceding rates across the relevant matches, so one heavy loss can outweigh several narrow wins. A small victory can even make an already strong NRR fall.
This guide shows broadcasters and league organizers how to trace that movement without pretending NRR tells the whole story.
Quick Summary: Key Takeaways
- NRR is cumulative. Do not average individual match NRR figures.
- Follow the standings after each fixture to see when the number rose or fell.
- Use a match-removal test to estimate which result is the biggest drag on the final figure.
- A win can lower cumulative NRR if its run-rate advantage is weaker than what came before.
- An early heavy defeat can remain visible deep into a tournament.
- All-out innings need special treatment. Under ICC rules, the full allotted quota is used for NRR when a team is dismissed early.
- Match-removal analysis is a diagnostic technique, not an official ICC ranking formula.
- When comparing apps like CricClubs, test whether the underlying NRR inputs can be audited rather than merely checking whether a number appears on the points table.
For the basic formula first, use The 12th Men guide to how net run rate is calculated.
What Does “Which Match Hurt Our NRR?” Actually Mean?
There are really two questions hiding inside that sentence.
Question 1: After which match did our NRR fall the most?
That is a chronological question. Calculate the cumulative figure after every fixture and compare the movement.
Question 2: Which result is the biggest drag on our final NRR?
That is a counterfactual question. Recalculate the final standings figures with each match removed one at a time.
They sound similar.
They are not identical.
The first depends partly on the order in which matches occurred. The second asks what the tournament numbers would look like without one result.
For broadcasters, using both gives a far better explanation than simply saying, “That loss was expensive.”
How Is NRR Actually Calculated?
ICC competition rules define net run rate as the difference between a team’s aggregate average runs per over scored and the aggregate average runs per over scored against it.
The current ICC playing-conditions library includes the 2026 tournament rules, while the formal NRR provision also specifies that a side bowled out early is treated as having faced its complete allotted quota for this calculation.
In simple form:
NRR = Aggregate scoring rate − Aggregate conceding rate
Or:
NRR = (Total runs scored ÷ overs faced) − (Total runs conceded ÷ overs bowled)
The word aggregate is doing a lot of work.
You do not calculate four match NRRs, add them together, and divide by four.
You add the underlying runs and eligible overs first.
That distinction is what makes our Falcons example interesting.
Which Match Hurt Net Run Rate in This Four-Match Example?
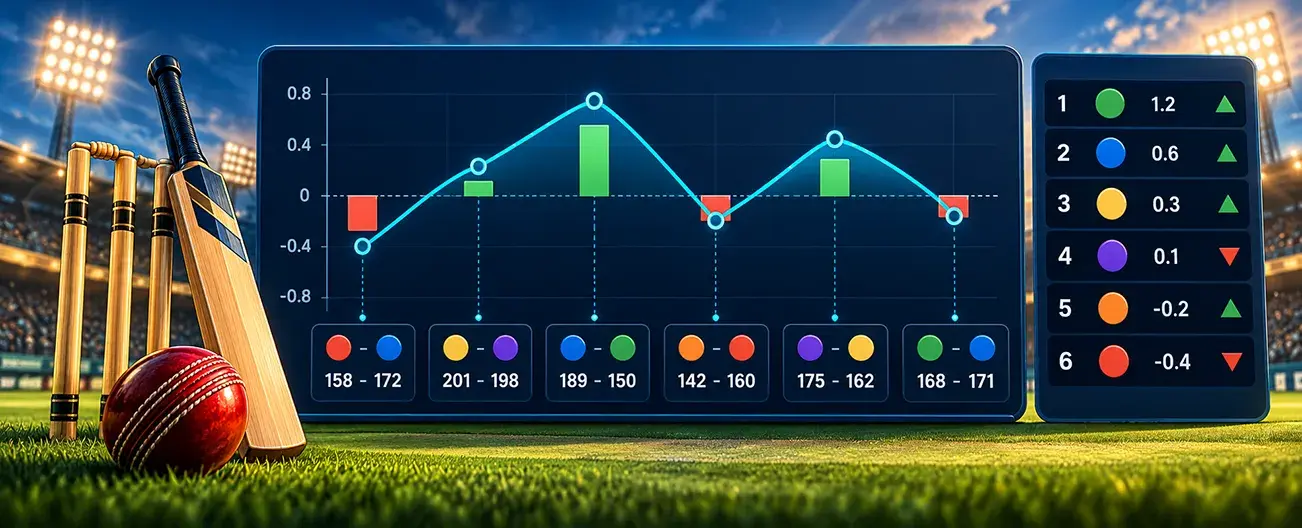
Imagine Falcons play a four-match T20 league stage.
These results are fictional so we can inspect the arithmetic cleanly.
| Match | Falcons | Opponent | Result | Single-match rate difference |
|---|---|---|---|---|
| Match 1 | 180/6 in 20 overs | 150/8 in 20 | Won | +1.500 |
| Match 2 | 161/5 in 18 overs | 160/7 in 20 | Won | +0.944 |
| Match 3 | 92 all out in 16.3 overs | 93/2 in 11 | Lost | −3.855 |
| Match 4 | 174/7 in 20 overs | 170/9 in 20 | Won | +0.200 |
At first glance, Match 3 looks obvious.
It probably should.
But let us prove it instead of trusting the eye.
One important adjustment comes first.
Falcons were all out for 92 in Match 3. For this NRR example, their batting denominator is the full 20-over allocation, not the 16.3 overs shown beside the innings score. That follows the ICC all-out rule.
Now we can rebuild the tournament.
What Happened to NRR After Each Match?
After Match 1:
Falcons scored 180 from 20 overs and conceded 150 from 20.
NRR = 9.000 − 7.500 = +1.500
Excellent start.
Then they win again.
You might expect the number to rise.
It does not.
After Match 2, the aggregate figures are:
Runs scored: 341 NRR balls faced: 228 Runs conceded: 310 Balls bowled: 240
The cumulative NRR becomes approximately:
+1.224
Two wins.
Lower NRR.
Why?
Because the second victory added a smaller run-rate advantage than the strong position Falcons already held after Match 1.
Then Match 3 happens.
Their cumulative figure collapses to approximately:
−0.436
Match 4 is a narrow win and lifts it slightly:
−0.288
Here is the story the broadcast graphic should show:
| Tournament point | Cumulative NRR | Change from previous position |
|---|---|---|
| After Match 1 | +1.500 | Starting point |
| After Match 2 | +1.224 | −0.276 |
| After Match 3 | −0.436 | −1.660 |
| After Match 4 | −0.288 | +0.148 |
Now we know exactly where the standings changed most sharply.
Match 3 caused the largest downward movement.
But there is another way to test it.
How Does the Match-Removal Test Work?

Take the completed tournament.
Remove one match.
Recalculate NRR from every other result.
Then put the match back and repeat the process with another fixture.
This is not an official ICC statistic. It is a useful analytical method for answering a broadcaster’s question: “Which result is dragging this final number down most?”
Falcons finish all four fixtures with:
607 runs scored from 468 NRR balls faced.
573 runs conceded from 426 balls bowled.
That gives:
Final NRR ≈ −0.288
Now remove each match separately.
| Match removed | Recalculated tournament NRR | What it tells us |
|---|---|---|
| Match 1 | −0.932 | Match 1 was helping substantially |
| Match 2 | −0.665 | Match 2 also helped the final number |
| Match 3 | +0.879 | Match 3 was the major drag |
| Match 4 | −0.436 | Match 4 provided a small recovery |
There it is.
Without Match 3, Falcons would sit around +0.879 instead of −0.288.
The difference is roughly 1.168 NRR points in this particular four-match set.
Do not add these removal differences together. Each calculation creates a different three-match tournament, so these are counterfactual comparisons rather than additive contributions.
Still, the answer is clear.
Match 3 hurt most. By a long way.
Can a Match Hurt NRR Even If We Win?
Yes.
Match 2 already showed it.
Falcons win, yet cumulative NRR falls from +1.500 to +1.224.
Think of it this way.
You arrive at a school test with an average of 95.
Then score 85.
Eighty-five is still a good mark.
Your average falls.
NRR behaves differently mathematically, but the intuition is useful. A positive match performance can still pull an already higher aggregate figure downward.
This is why commentators should avoid statements such as:
“They won, so their NRR has improved.”
Check first.
Sometimes it did.
Sometimes the team won while the number moved the other way.
Can One Bad Loss Follow a Team Through the Whole Tournament?
Yes, and there is a real World Cup example.
Pakistan finished the 2019 Cricket World Cup group stage level with New Zealand on 11 points and five wins, but missed the semifinal because New Zealand had the better net run rate. ICC’s CWC19 report card for Pakistan specifically identified Pakistan’s opening seven-wicket defeat to West Indies as a major blow to their NRR.
That opening match was brutal.
Pakistan were bowled out for 105, and West Indies completed the chase in 13.4 overs. ICC reported that the quick chase gave West Indies’ net run rate a substantial early boost.
Pakistan later won four consecutive matches to finish the tournament.
The opening damage still mattered.
That does not mean every early heavy defeat becomes impossible to repair. It means recovery depends on the aggregate rates created by everything that follows.
For broadcasters, this creates a far better storyline than simply saying:
“Pakistan needed a big win.”
The deeper story is that an old result was still present in the tournament mathematics.
Should We Call the Worst-NRR Match Our Worst Performance?

Not automatically.
NRR measures scoring rate against conceding rate under a specific tournament formula.
It does not directly reward wickets retained in an ordinary completed chase. It does not know whether a pitch was unusually difficult. It does not separately score dropped catches, opposition quality, injuries, or tactical circumstances.
Researchers Prashant Premkumar, Jimut Bahan Chakrabarty, and Shovan Chowdhury took a much broader approach in their 2020 research on ODI player rankings. Their model used match-by-match factor scores and several contextual performance indicators rather than relying on one conventional statistic.
That research concerns player ranking, not tournament NRR attribution.
The useful point for a broadcast desk is this:
The match that damaged the standings metric most is not automatically the match in which every player performed worst.
Keep those ideas separate.
Why Should Broadcasters Be Careful With NRR Narratives?
Because NRR itself has limits as a ranking measure.
Statistician Steven Stern discussed those limits in his 2020 conference paper, Did Herschelle Gibbs Really Drop the 1999 Cricket World Cup: and other uses of the Duckworth-Lewis Methodology, while exploring alternative measures of winning margin and team ranking. His work specifically highlighted cases where NRR can be unsatisfactory as a secondary tournament-ranking criterion.
You do not need to reject NRR to learn from that.
Your tournament rules decide the standings.
Your broadcast job is to explain what those standings mean without turning one number into a verdict on the entire team.
A useful phrase is:
“This was the match that had the biggest negative effect on their NRR.”
That is more defensible than:
“This was their worst cricket of the tournament.”
The first describes the calculation.
The second makes a wider sporting judgment.
What Should Cricket League Software Show?
A points table with NRR is useful.
For broadcasters, it is not enough.
We would want access to the ingredients underneath it:
- Runs scored by match
- NRR balls or overs faced
- Runs conceded
- NRR balls or overs bowled
- All-out adjustments
- Rain or DLS treatment
- NRR after each completed fixture
- Scorecard corrections
- Current qualification scenarios
The 12th Men currently documents ball-by-ball cricket scoring, automatic points-table and NRR updates after matches, and NRR qualification scenarios.
Its cricket league management platform also brings scoring and tournament management into the same cricket workflow.
For qualification scenarios, the related NRR Qualification Guide is the natural next article.
What Should You Check in Apps Like CricClubs?

If you are comparing apps like CricClubs, do not stop at:
“Does it show NRR?”
Almost every serious evaluation should go one level deeper.
Ask:
- Can I see the scorecards behind the number?
- Does an all-out innings use the competition’s correct NRR denominator?
- Can I inspect legal balls rather than relying on formatted overs?
- Does a corrected score automatically update standings?
- Can I view the NRR after individual fixtures?
- Can the tournament handle its own tiebreak order?
- Can broadcasters access qualification scenarios without maintaining another spreadsheet?
The same test applies when assessing any CricClubs competitor.
Do not compare logos.
Take the same four Falcons matches from this article, enter them into both systems, and see whether the final result is reproducible.
That is a meaningful cricket league software test.
For a connected scoring workflow, The 12th Men also documents live score updates and standings refreshes within its scheduling and scoring system.
How Should a Broadcast Explain the Damage in 20 Seconds?
Keep it visual.
Try:
Falcons NRR story
After Match 1: +1.500 After Match 2: +1.224 After Match 3: −0.436 Current: −0.288
Then say:
“Match 3 is the big one. Falcons were bowled out for 92, and the chase finished in 11 overs. If we remove that result from this four-match example, their NRR moves from −0.288 to about +0.879.”
That is understandable.
It is traceable.
And it gives the audience a reason to care about a match that happened days ago.
Stop Saying “Our NRR Is Bad.” Find Out Why.
The producer in our fictional broadcast finally has the answer.
Falcons did not have a mysterious standings problem.
They had one enormous dent.
Match 1 built a cushion.
Match 2 was another win, but softened that cushion.
Match 3 smashed through it.
Match 4 repaired a little of the damage.
Once you can see that sequence, NRR stops looking like an unexplained decimal on the right side of a table.
That is the real value of asking which match hurt net run rate.
Do not just display the number.
Trace it.
Explain it.
Then show teams what the next match can realistically repair.
Explore The 12th Men cricket platform and test your own league with a difficult dataset: one large win, one narrow win, one heavy all-out defeat, and one close finish. Check whether the scorecards, standings, NRR, and qualification scenarios all tell the same story.
FAQ
Got Questions? We've Got Answers.
Recalculate the team’s cumulative NRR after every fixture to find the biggest downward movement. For deeper analysis, remove each match one at a time and recalculate the final NRR. Treat the removal method as analysis, not an official tournament statistic.
Yes. If the latest victory adds a smaller rate advantage than the team’s existing aggregate position, cumulative NRR can fall even though the team earns the win.
No. ICC NRR uses aggregate runs and overs across the applicable matches. Individual match NRR figures should not simply be averaged.
Yes. Under ICC-style NRR rules, a team dismissed before completing its allotted overs is treated as having faced its full quota for NRR purposes.
Yes. The effect remains inside the aggregate totals until later results change the overall scoring and conceding rates enough to offset it. Pakistan’s 2019 World Cup campaign is a documented example where ICC highlighted the damaging effect of an early heavy defeat on NRR.
Related Articles

Cricket
Cricket Auction Registration Form: Field-by-Field Guide
Plan a clean registration flow from the first field to final approval. The guide covers player details, custom questions, multi-step forms, payments, verification and which information should appear on the public auction display.
Read More > Yug Shah|Oct 12, 2026|

Cricket
Sold, Unsold and Re-Auction Rules for Cricket Leagues
Write clear outcome rules before bidding begins. Define when a player is sold, how unsold players return, when re-auction is allowed and how an organizer can correct or undo the last bid without creating disputes.
Read More >Yug Shah|Oct 5, 2026|